

This December I’ve gotten in some practice talking about Bridge Grades with the media (TV, radio, podcasts). Pesky predilection for expansive answers aside, it’s been very helpful in sharpening our messaging.
In these sessions, it’s common for the interviewer to question specific scores that surprise them.

Julie Mason, host of SiriusXM’s radio show POTUS, shared with me her surprise regarding Sen. Chuck Grassley’s (IA) and Sen. Alex Padilla’s (CA) A grades. In other conversations I’ve been quizzed on how Sen. Ted Cruz (TX) and Rep. Byron Donalds (FL-19) earn Bs.
I love these sorts of challenges. Honestly, I don’t know either, without looking at the data. In these cases, I double-click into back-end spreadsheets, and see for myself where they gain points against their peers and on which dimensions they lose ground against the field.
Upon reflection to this pattern of query, I share three thoughts. Cue pesky predilection for expansiveness.
One, I accept that our system may generate false positives and false negatives. The rubric for sure has room to sharpen. Still, I stand by the quality of our 3rd party data sources, and believe our methods, if still crude, are defensible.
Two, the need to understand the components of each specific grade validates our priority one to build individual web pages for each of the 535 legislators. We’ll display the composition of each member’s grade and how their scores have trended over time. Once citizens can more easily understand the composition of the grades—and see for themselves how an A grade is earned, for example, when a Senator or House Rep is more active than their peers in authoring bills that earn cross-party sponsorship—then the entire Bridge Grades rubric becomes more trustworthy.
Three, in these types of questions, I recognize bias and our natural human tendency to demonize the other. We intuitively associate strong ideological beliefs (in the other) with divisive behavior: when we think of an ideologue, our bias is they are uncollaborative. But, the data doesn’t back that up…
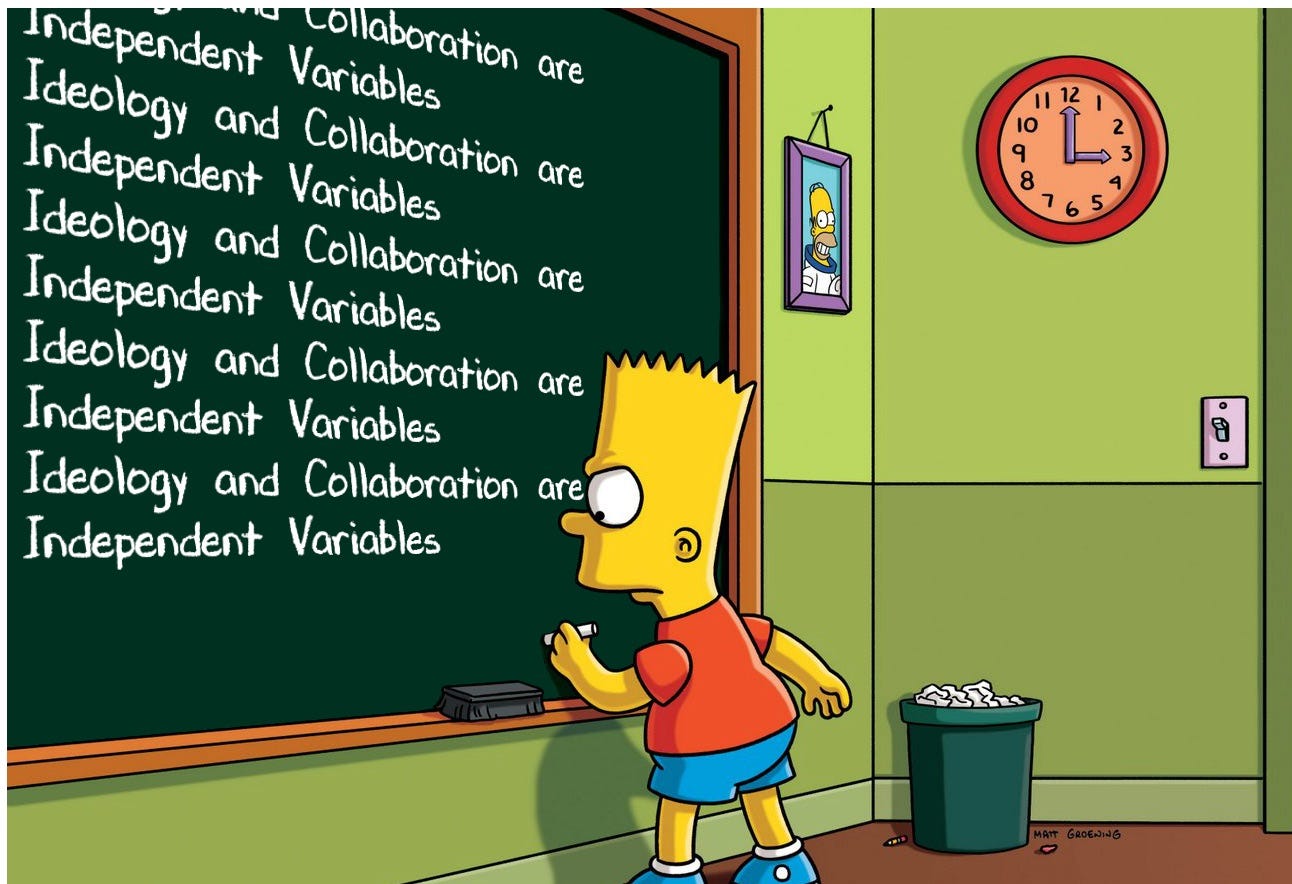
…Because Ideology and Collaboration are Independent Variables
To understand what I mean, let’s inspect the scatter chart below. Each dot represents a member of Congress.
On the horizontal axis is each legislator’s ideology score using an industry standard dimension called DW-NOMINATE (dim1) produced by Voteview.
On the vertical axis is each legislator’s most recent Bridge Score based on data that measures legislative record and rhetoric analysis over their first 11 months of governing this 119th Congress.
[Email recipients: Click here for an interactive version where you can mouse-over the dots and see the underlying data.]
Two takeaways from the chart
One, Congressional representation in the ideological center is missing altogether. But, everyone already knew that.
Two, while there is a vague visible trend-line between ideological extremes and low bridge grades (lower left, lower right), the purple dots (bridgers) span nearly the full ideological spectrum left-to-right from Rep. Sean Casten to Rep. Troy Downing. Meanwhile, plenty of the more centrist legislators earn Cs and even Fs.
This data demonstrates that Bridge Grades is neither a proxy for being moderate (otherwise all of the As would be clustered in the center of the left-right axis), nor does it punish ideological extremes (all Cs and Fs would be in the far wings of each side).
Instead, our measure finds those who hold their beliefs while deliberately choosing to build coalitions with those who hold different beliefs. The data helps us find those with the intent to find solutions for common interests—pragmatists who focus on win-win solutions versus dogmatists who keep us stuck in zero-sum games.
Because, let’s say it all together now, ideology and collaboration are independent variables.
(Hat tip: Vanessa Otero at Ad Fontes Media).
Bridge Grades is a non-ideological report card for politicians. Using 3rd party data, we grade politicians on their ability to collaborate and build consensus solutions for the common interests. Like a polarization score. In aggregating data from multiple non-partisan 3rd party sources, Bridge Grade is like Rotten Tomatoes for politicians.